One of the best
places for learning about seismology and earthquakes is at the
United States Geological
Survey (USGS) earthquake websites at http://earthquake.usgs.gov/learn.
Frequently
asked questions about earthquakes
Can you predict
earthquakes?
No. Neither
the USGS nor Caltech nor any other scientists have ever predicted a
major earthquake.
They do not know how, and they do not expect to know how any
time in the foreseeable future.
However based on scientific data, probabilities can be calculated for
potential future earthquakes.
For example, scientists estimate that over the next 30 years the
probability of a major EQ occurring
in the San Francisco Bay area is 67% and 60% in Southern
California.
The USGS focuses their efforts on the long-term mitigation of
earthquake hazards by helping to
improve the safety of structures, rather than by trying to accomplish
short-term predictions.
Why are we having so many
earthquakes?
Has earthquake activity been increasing? Does this mean a big one is
going to hit?
OR
We haven't had any earthquakes in a long time; does this mean that the
pressure is building up?
Although it may seem that we are having more earthquakes,
earthquakes of magnitude 7.0 or greater have
remained fairly constant throughout this century and,
according to our records,
have actually seemed to decrease in recent years.
There are several reasons for the perception that the number of
earthquakes, in general,
and particularly destructive earthquakes is increasing.
1) A partial
explanation may lie in the fact that in the last twenty years, we have
definitely had an increase
in the
number of earthquakes we have been able to locate each year. This is
because of the tremendous
increase
in the number of seismograph stations in the world and the many
improvements in global communications.
In 1931, there
were about 350 stations operating in the world; today, there are more
that 4,000 stations
and the
data now comes in rapidly from these stations by telex, computer and
satellite.
This increase in
the number of stations and the more timely receipt of data has allowed
us and other
seismological
centers to locate many small earthquakes which were undetected in
earlier years,
and we are able to
locate earthquakes more rapidly.
The NEIC now
locates about 12,000 to 14,000 earthquakes each year or approximately
50 per day.
Also, because of
the improvements in communications and the increased interest in
natural disasters,
the public now
learns about more earthquakes. According to long-term records (since
about 1900),
we expect about 18
major earthquakes (7.0 - 7.9) and one great earthquake (8.0 or above)
in any given year.
However, let's
take a look at what has happened in the past 32 years, from 1969
through 2001, so far.
Our records show
that 1992, and 1995-1997 were the only years that we have reached or
exceeded the
long-term
average number of major earthquakes since 1971. In 1970 and in 1971 we
had 20 and 19 major
earthquakes,
respectively, but in other years the total was in many cases well below
the 18 per year which
we may expect
based on the long-term average.
2) The population at
risk is increasing. While the number of large earthquakes is fairly
constant, population
density in
earthquake-prone areas is constantly increasing. In some countries, the
new construction that
comes with
population growth has better earthquake resistance; but in many it does
not. So we are now
seeing increasing
casualties from the same sized earthquakes.
3) Better global
communication. Just a few decades ago, if several hundred people were
killed
by an earthquake
in Indonesia or eastern China, for example, the media in the rest of
the world would
not know about it
until several days, to weeks, later, long after such an event would be
deemed newsworthy.
So by the time
this information was available, it would probably be relegated to the
back pages of the
newspaper, if at
all. And the public Internet didn't even exist. We are now getting this
information almost immediately.
4) Earthquake
clustering and human psychology. While the average number of large
earthquakes per year
is fairly
constant, earthquakes occur in clusters. This is predicted by various
statistical models,
and does not imply
that earthquakes that are distant in location, but close in time, are
causally related.
But when such
clusters occur, especially when they are widely reported in the media,
they are noticed.
However, during the
equally anomalous periods during which no destructive earthquakes
occur,
no one deems this as
remarkable.
A temporal increase in earthquake activity does not mean that a large
earthquake is about to happen.
Similarly, quiescence, or the lack of seismicity, does not mean a large
earthquake is going to happen.
A temporary increase or decrease in the seismicity rate is usually just
part of the natural variation in the
seismicity. There is no way for us to know whether or not this time it
will lead to a larger earthquake.
Swarms of small events, especially in geothermal areas, are common, and
moderate-large magnitude
earthquakes will typically have an aftershock sequence that follows.
All that is normal and expected earthquake activity.
 The Earth's Interior
Five billion years ago the Earth was formed
by a massive conglomeration of space materials.
The heat energy released by this event melted the entire planet, and it
is still cooling off today.
Denser materials like iron (Fe) sank into the core of the Earth, while
lighter silicates (Si), other
oxygen (O) compounds, and water rose near the surface. The earth is
divided into four main layers:
the inner core,
outer core, mantle, and crust. The core is
composed mostly of iron (Fe) and is so hot
that the outer core is molten, with about 10% sulfur (S).
The inner core is under such extreme pressure that it remains solid.
Most of the Earth's mass is in the mantle,
which is composed of iron (Fe), magnesium (Mg), aluminum (Al),
silicon (Si), and oxygen (O) silicate compounds. At over 1000 degrees
C, the mantle is solid but can deform
slowly in a plastic manner. The crust is much thinner than any of the
other layers, and is composed of the
least dense calcium (Ca) and sodium (Na) aluminum-silicate
minerals.
Being relatively cold, the crust is rocky and
brittle, so it can fracture in earthquakes.
This is a brief summary of our knowledge of
the earth's interior. For further information, read a more detailed
description at the University of Nevada's Seismological Laboratory
pages.
P
and S Waves
When an earthquake occurs, it releases energy
in the form of seismic waves that radiate from the
earthquake source in all directions. The different types of energy
waves shake the ground in different ways
and also travel through the earth at different velocities. The fastest
wave, and therefore the first to arrive
at a given location, is called the P wave.
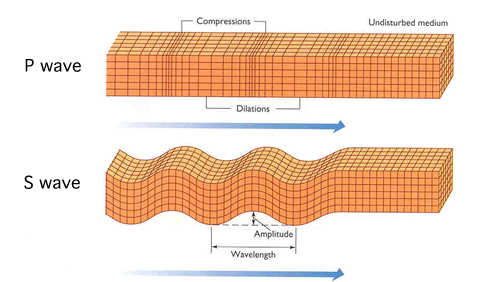
The P wave, or compressional wave, alternately compresses
and expands material in the same direction it is traveling. The S
wave is slower than the P wave and arrives next,
shaking the ground up and down and back and forth perpendicular to the
direction it is traveling.
Surface waves follow the P and S waves.
See
also Figure 2 "Time-travel Curves" below for more discussion of the
propagation
of P and S waves through the earth.
Hypocenter
(or Focus) vs Epicenter
The
earthquake hypocenter (also
commonly referred to as the earthquake focus) is the
point within the earth where an earthquake rupture starts.
The epicenter is the point directly above the hypocenter
(focus) at the surface of the Earth.
Seismographs
- Keeping Track of Earthquakes
Ref: http://earthquake.usgs.gov/learn/topics/seismology/keeping_track.php
Throw
a rock into a pond or lake and watch the waves rippling out in all
directions from the point of impact.
Just
as this impact sets waves in motion on a quiet pond, so an earthquake
generates seismic waves that
radiate out through the
Earth.
Seismic
waves lose much of their energy in traveling over great distances.
But sensitive detectors (seismometers) can record theses waves emitted
by even the smallest earthquakes.
When these detectors are connected to a system that produces a
permanent recording, they are called seismographs.
There
are many different types seismometers, but they all are based on the
fundamental principle - that the differential
motion between a free mass
(which tends to remain at rest) and a supporting structure anchored in
the ground
(which moves with the vibrating Earth) can be used to record seismic
waves.
Figure
1.
Simple
Seismographs
Seismographs are designed so that slight earth vibrations move the
instruments; the suspended mass (M),
however, tends to remain at rest, and its recording stylus records this
difference in motion.
The horizontal seismograph shown here moves only in the horizontal
plane.
Vertical seismographs, like the simple one shown here, use a "soft"
link between the earth-anchored
instrument and the suspended mass. In this design, the mass hangs from
a spring, which absorbs some
of the motion and causes the mass to lag behind actual motion.
This
principle is illustrated in the Figure 1 above.
Vertical support AB holds mass M in position by wire AM and by strut BM
at point B.
The system becomes a seismometer when the vertical support is embedded
in a concrete pier attached to
the Earth. If there is no friction at the point B and mass M
is reasonably large, the movement of the pier
and the attached upright support in response to an earthquake wave
will set up a differential motion between
the mass and the pier (the inertia of the mass will make it
remain at rest).
This motion - the signal of an earthquake wave - can then be recorded
on a revolving drum.
When the pier is steady, the pen attached to the mass writes a straight
line. But when the pier shakes,
the mass and strut wiggle, recording waves from the earthquake that
started the boom in motion.
Usually,
the drum rotates on a screw-threaded axle so that the recording pen
moves on a continuously advancing
record and does not simply repeat the same circle over and over.
Because time - both the time of day
and the synchronization of events - is an important element in
seismology,
clocks are always part of a seismograph system.
A
single seismograph pendulum works in only one direction, and cannot
give a complete picture of
wave motions from other directions. To overcome this problem,
modern seismograph stations have
three separate instruments to record horizontal waves - (1) one to
record the north-south waves,
(2) another to record east-west waves, and (3) a vertical one in which
a weight resting on a spring
tends to stand still and record vertical ground motions. The
spring-suspended mass lags behind the
motion caused by the earthquake, making the pen record the waves on the
drum. This combination of
instruments tells a seismologist the general direction of the seismic
wave source, the magnitude at
its source, and the character of the wave motion. Instruments at other
stations must be used to get a
precise fix on the earthquake's epicenter.
As
explained earlier, an earthquake generates a series of waves that
penetrate the entire Earth, and travel at
and through its surface. Each wave has a characteristic velocity and
mode of travel.
They are quite complex, but a few basic facts will explain how they
travel through the Earth and how
an earthquake's epicenter can be determined from seismograph
records.
Locating
Earthquakes
There
are four basic types of seismic waves; two preliminary body waves that
travel through the Earth,
and two that travel only at the surface (L waves). Combinations,
reflections, and diffractions produce an
infinity of other types, but body waves are the main interest in this
discussion.
Body
waves are composed of two principal types; the P (primary) wave,
comparable to sound waves,
which compresses and dilates the rock as it travels forward through the
Earth; and the S (secondary) wave,
which shakes the rock sideways as it advances at barely more than half
the P-wave speed.
 The
P wave is designated the primary preliminary wave
because it is the first to arrive at a seismic station
after
an earthquake. It travels at a speed usually less than 6
kilometers per second in the Earth's crust and
up
to 13 kilometers per second through the core.
The
S wave is the secondary preliminary wave to be recorded. It follows
paths through the
The
P wave is designated the primary preliminary wave
because it is the first to arrive at a seismic station
after
an earthquake. It travels at a speed usually less than 6
kilometers per second in the Earth's crust and
up
to 13 kilometers per second through the core.
The
S wave is the secondary preliminary wave to be recorded. It follows
paths through the
Earth quite similar to those of the P-wave paths, except that no
consistent evidence has yet been found
that the S wave penetrates the Earth's core.
The
lines labeled P, S, and L in the curves shown on Figure 2 represent the
travel time required
for each phase at distances of 0 to 1300 kilometers from the
earthquake's epicenter.
They mark the points on the record at which these waves first arrive at
the station.
Figure 2.
Travel-time
curves with idealized seismograms (earthquake records superimposed).
Use
a Travel-Time Curve Chart
to Approximate the Distance to an Earthquake
The
simplest method of locating an earthquake on a globe is to find the
time interval between the P-wave
and S-wave arrivals at several seismograph stations. The distance to
the earthquake from each station
is then determined from standard travel-time tables and travel-time
curves.
To
find the distance to the earthquake from a particular station, look at
the event's seismogram and find the time
difference between the P
wave and S-wave arrivals. A rough approximation of
this distance can be rapidly made
using graphical methods and a travel-time curve
chart, such as the
one shown below: click on it to open a larger
image, then save and print it out, or work directly on the on-screen
image.
1. measure the distance on the
curve's left (vertical)
axis that equals the P-S wave arrival time difference
(hint: use a
piece of blank paper placed next to the travel-time curve chart's time
scale; make two
marks along one edge of the paper, at "0", and at the value
of the
seismogram's P-S wave arrival time difference).
2. Slide the paper (keeping the edge vertical) upward and to
the right along the P and S curves until
the
separation between the two curves lines up with the two marks you just
made.
At that point, drop
vertically down the chart and read the distance to
the earthquake epicenter.

--------------------------------------------------
Another
method of locating an earthquake is to use the P-wave arrival-time
minus origin-time (P - O) interval
instead of distance. This method is more common because the time can be
taken directly from surface
focus travel-time tables assuming an origin of 00:00 hours. This
method, however, requires that travel-time tables
be available for various depths of focus. For locating a deep shock,
one 700 kilometers deep, for example,
travel-time tables and travel-time curves for that depth have to be
used to calculate the origin time and distances.
Other
wave types can be generated inside the Earth by P and S waves, as shown
in Figure 3. As many as five different
wave groups or phases can emerge when a P or S wave encounters a
discontinuity or interface within the Earth.
Figure
3.
Propagation paths of
combinations of P, S, and L waves from an earthquake focus
------------------------------
More
to come ...